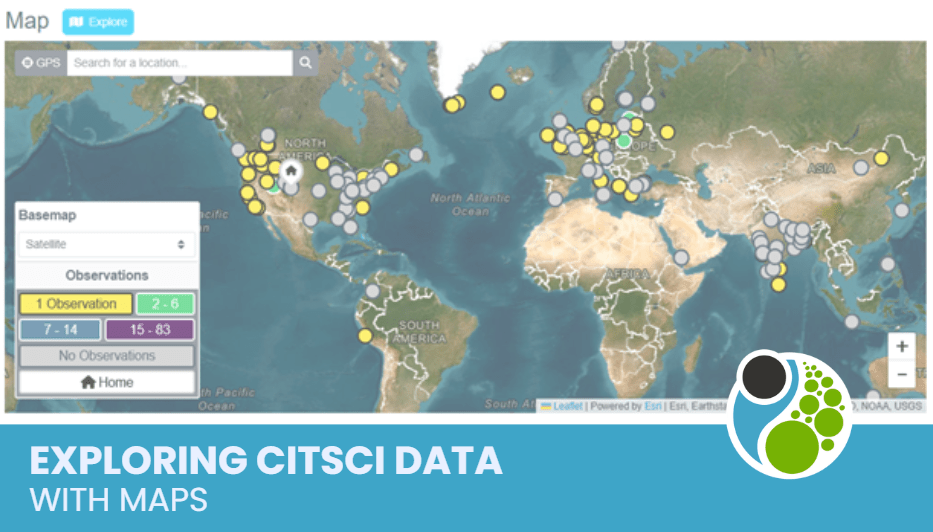
You’ve created your participatory science project and participants are reporting data on CitSci. Awesome! Now, how do you make sense of all that data? You might start by looking at it on a map (a geospatial analysis) to look for patterns, gaps, and other clues about what is happening. With CitSci, project managers and participants
