
Thanks for reading our quick guide series!
Part one covered research questions and big picture planning.
Part two (this post) covers design, data collection, and volunteer management.
Part three covers results and follow-up.
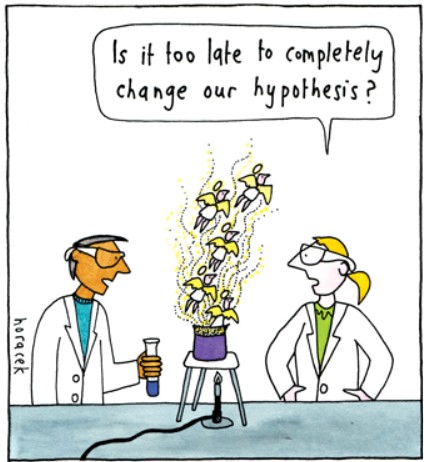
Ready to start your project? Have your research questions ready? Now it’s time to think about whether you need a hypothesis.
A natural step that follows creating your research question is coming up with a hypothesis (or more than one hypothesis). We have a longer blog post on the topic, but good rules of thumb are to make sure your hypothesis clearly states the relationship between two variables, is testable with the data you plan to collect, and is specific enough to guide your study design without introducing bias.
While many citizen science projects are built around testing a hypothesis, not all of them have to be. Some of the most valuable projects aren’t trying to prove or disprove something: they’re about observation, monitoring, or documenting change over time.
For example:
⬤ Phenology projects (like tracking the first bloom dates of flowers each year) are usually about long-term monitoring, not testing a specific cause-and-effect relationship.
⬤ Mapping projects that document the presence or spread of invasive species focus on building a picture of what’s happening, without necessarily testing for a relationship between two variables.
⬤ Community-based projects might aim to gather baseline data on water quality, air quality, or biodiversity to inform future action — without starting with a formal hypothesis.
These kinds of projects are just as important. They provide critical baseline data, reveal patterns we wouldn’t have otherwise noticed, and often help communities advocate for change.
So if you don’t have a specific hypothesis in mind, that’s okay. You can still create a meaningful, rigorous citizen science project by:
⬤ Defining clear goals (What do you want to observe? Track? Understand?)
⬤ Standardizing your data collection methods
⬤ Planning ahead for how you’ll visualize and share what you learn
The bottom line? Citizen science is about curiosity and discovery. Whether you’re testing a hypothesis or simply documenting the world around you, your project matters—and CitSci.org is here to support both approaches.
But if You DO Need a Hypothesis…
In plain language, coming up with a hypothesis entails writing a statement that you want to test: something you can actually check with the data you (or your volunteers) will collect.
For example, let’s say your research question is: Do native plants attract more pollinators than non-native plants in urban gardens in Cleveland?
Your hypothesis could be: Bee visitation rates are higher on native wildflowers than on non-native ornamental plants in urban gardens in Cleveland during summer months.
In this case:
⬤ The independent variable is the plant type (native vs. non-native). This is what you’re comparing.
⬤ The dependent variable is the bee visitation rate — the number of bees observed visiting a plant in a given time period. This is what you’re measuring.
To test this using citizen science, you’d ask volunteers across Cleveland to:
⬤ Observe garden plots containing both native and non-native plants
⬤ Record the number of bee visits per plant type during specific timed intervals. Tip: tell participants to pick a standard time and location to monitor (e.g. same time on Mondays at the same location for two months) to control for the variables of time and location
⬤ Log contextual information like date, time, temperature, and plant species
To analyze the data, you could:
⬤ Calculate the average number of bee visits for native plants and for non-native plants.
⬤ Use basic statistical tests (like a t-test, because in this example, your data is likely normally distributed, which means that it follows a bell-shaped curve whose observations are symmetrically distributed around the average) to see if the difference in bee visitation between plant types is statistically significant. If you’re struggling with which type of statistical test to use for your data (and you don’t have a clue what normal data are!), don’t fret! We recommend finding an undergrad studying data science to help you. You can email caroline.nickerson@colostate.edu for recommendations.
⬤ Visualize the results in a simple bar graph to show any differences over time.
Note: you won’t be analyzing the data quite yet, but as you’re setting up your hypothesis, it’s worthwhile to think through HOW you will eventually analyze the data.
Designing Your Project on CitSci
Whether you have a hypothesis or not, to complete your project, you’ll likely need volunteers to help you collect or analyze data.
Read this blog post to learn how to set up your first project and datasheet.
Keeping Your Volunteers Engaged
Once you have one or more datasheets, you’ll want to recruit volunteers, maybe through your local library, school groups, a Rotary Club, or just word of mouth (SciStarter is a great resource for recruiting volunteers, through both their people finder tool and their Ambassador program. Also, we recommend opting in to become a SciStarter affiliate project to recruit more volunteers: it’s super easy and just takes one click! More on that in this blog post).
You’re ready to start collecting data. Now, it’s time to make sure your participants stay informed, connected, and excited to keep going.
We recommend creating a simple communications plan before you launch. It doesn’t have to be complicated. It just needs to answer: how will you keep in touch with your participants throughout the project?
Here’s how to get started:
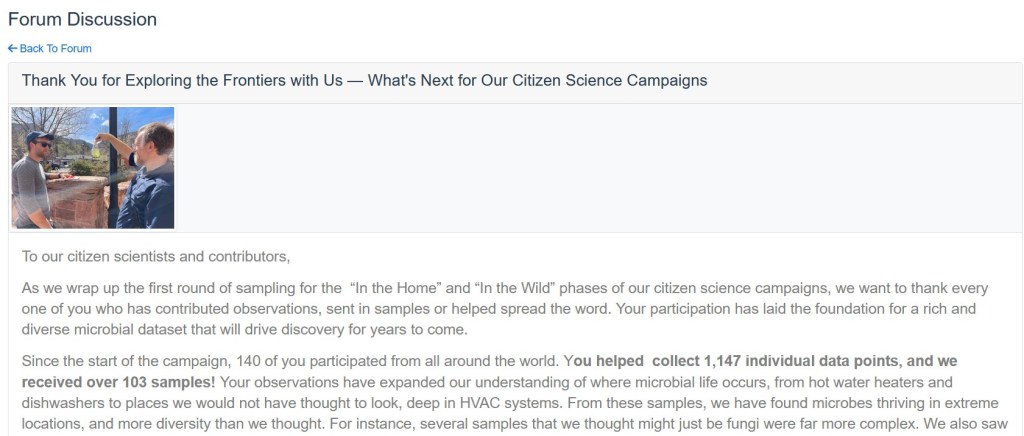
⬤ Use CitSci’s Forum Tool: CitSci.org makes it easy to email all your project participants using the built-in forum feature. You can send updates, reminders, data highlights, and event invites without setting up a separate mailing list. The Extremophile Campaign used this feature particularly well.Just click the “forum” tab on your project, and you can post for participants. We recommend checking the “email” box when posting on the forum, so all participants also see the update in their inbox.
⬤ Forums are also a great space for two-way communication. For example, Perennial Atlas project often engages their participants in dialogue and makes programmatic changes based on user feedback.
⬤ Set a Regular Update Schedule: Decide how often you’ll reach out. For example, weekly updates during busy field seasons, monthly newsletters for longer-term projects, and special announcements after major milestones (like reaching 100 observations)
⬤ Consistency builds trust and keeps your project top-of-mind.
⬤ Share More Than Just Data Requests: Make updates interesting! Mix in: (1) Fun facts and interesting trends from the data, (2) Participant shoutouts (like “Volunteer of the Month”), and (3) Invitations to optional trainings, webinars, or local meetups.
⬤ Keep Communication Two-Way: Invite volunteers to reply, ask questions, and share feedback or field stories. Treat them like collaborators, not just data collectors.
⬤ Recognize Participants’ Contributions: Think about ways to formally recognize your volunteers’ efforts. If you’re publishing findings—whether it’s a public report, article, or poster presentation—consider listing active participants as co-authors or contributors when appropriate.
⬤ Even if you’re not publishing, you can still: (1) Send personalized certificates, (2) Highlight top contributors in your end-of-season summary, (3) Plan a Thank-You at the End
⬤ When data collection wraps up, make sure to close the loop. Summarize results, celebrate achievements, and thank everyone involved. A little gratitude goes a long way in building long-term community around your project.
Speaking of sending thank yous…how do you know that your project is done, and that your results are meaningful? Read on for part three of this series!
